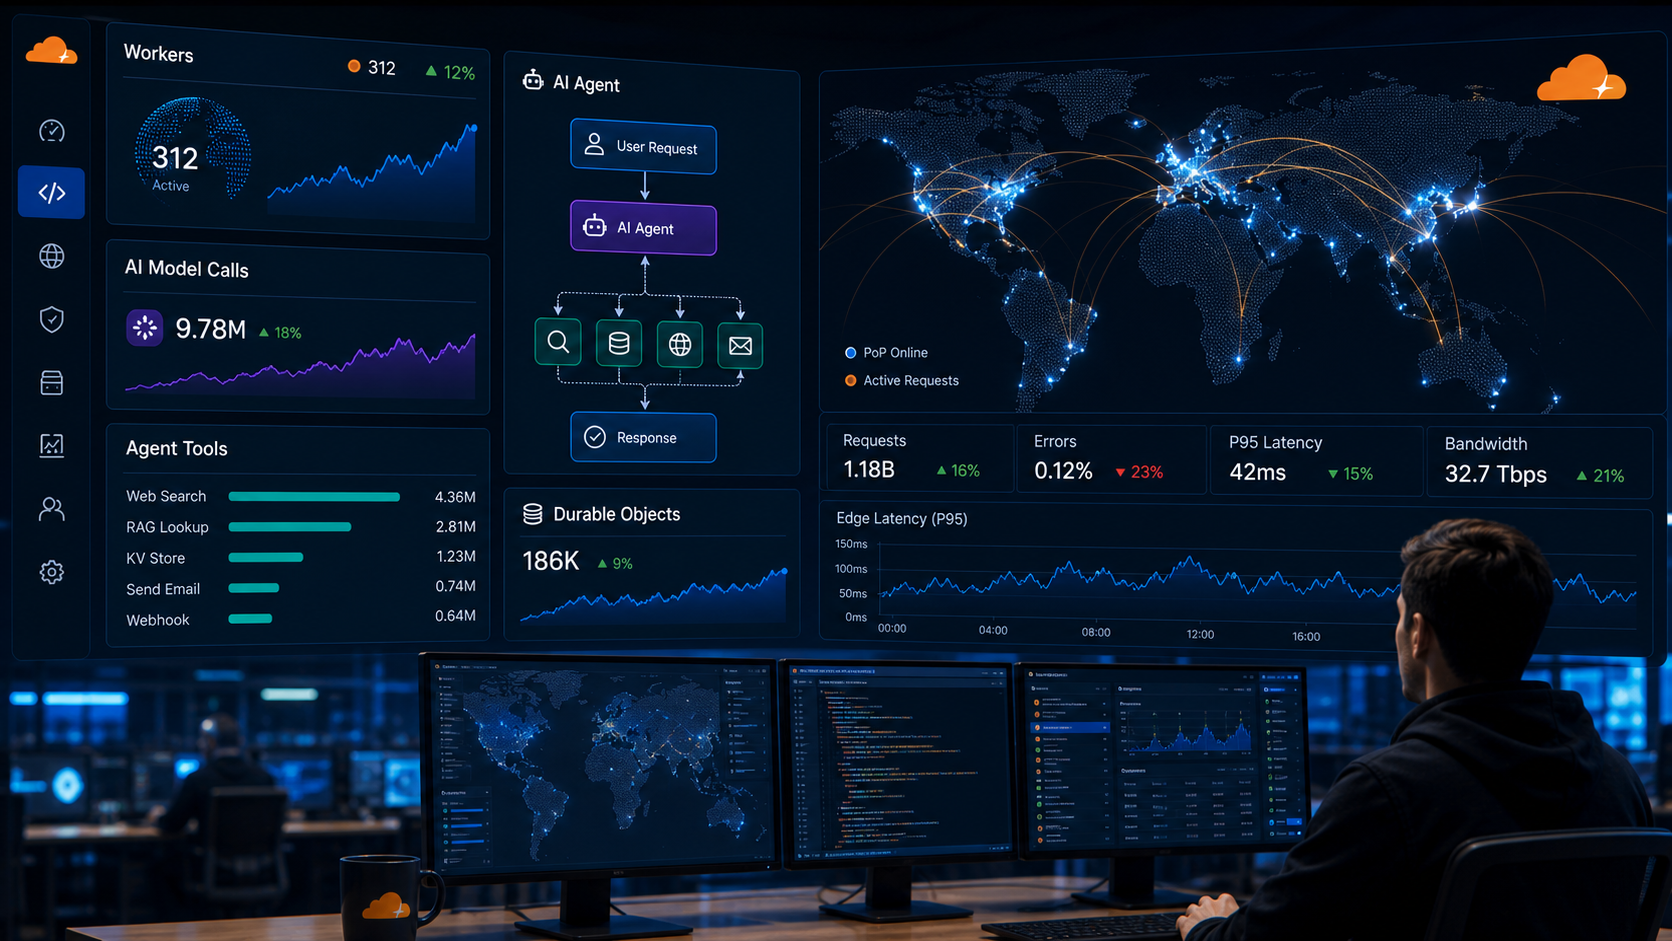
Cloudflare has announced support for on-demand CPU and memory profiling of Workers and Durable Objects. The feature provides interactive flamegraphs to understand which functions consume CPU time or memory, and allows downloading the profile for further analysis. Profiling is intended to help developers observe production behavior rather than relying solely on logs or aggregate metrics.
From the Workers Observability page, users can request a profile for an active Worker, then inspect the results in a flamegraph and download the raw profile file for offline review.
HOW TO USE THE NEW PROFILING TOOLS
Profiling can be initiated via the Cloudflare Dashboard or the CLI. In the dashboard, developers navigate to Build → Compute → Workers & Pages, select a Worker, and open its Observability tab to choose Flamegraph. The profiler can capture both CPU and memory data, and supports selecting different Worker versions to profile. TechStaged has also covered Cloudflare unveils Streamline for custom video pipelines powered by Stream and Workers.
For CLI users, the cf package is required to run profiling commands. The profiling tools are designed to observe real production execution rather than starting a new isolated instance for profiling. If a Worker has limited traffic, obtaining a representative profile may be more challenging.
- Access profiling in the Dashboard under Build → Compute → Workers & Pages
- Choose the Flamegraph option to capture CPU or memory profiles
- Optionally profile different versions with sufficient traffic
- Use the downloaded profile file for deeper analysis
WHAT YOU SHOULD KNOW BEFORE YOU START
On-demand profiling has some limitations. A profiling session must be explicitly started, which means you can miss rare misbehavior periods unless you profile specific windows.
The memory profiler shows allocations that occurred within the profiling window; startup-time memory usage may not be captured if it happens before profiling begins.
Cloudflare notes that continuous profiling is in development, which would automatically capture profiling data for easier access to rare events in production.
Durable Objects can be profiled by name, targeting a specific actor, and the runtime routes the profiling request to the correct metal that owns that object. Workers are profiled by the selected isolate within the requested data center.
- Profiling must be started manually
- Memory allocations are window-bound
- Continuous profiling is in development
- Durable Objects allow targeted profiling by name
WHAT BENCHMARKS AND ANECDOTES SHOW THE TECHNIQUE’S VALUE
Cloudflare cites practical uses of profiling to identify memory leaks and CPU inefficiencies in production. A representative CPU profile of a Worker implementing an R2 binding highlighted a function that was consuming disproportionate CPU time. By examining the flamegraph and accompanying table view, developers identified a function, originally responsible for repeated JSON processing, that could be optimized, resulting in a multifold performance improvement after code adjustments.
In another case, profiling surfaced memory pressure caused by partially-disabled Prometheus instrumentation. Removing that code path reduced memory usage, improving headroom below the 128 MB limit and reducing out-of-memory errors. These examples illustrate how production profiling can link resource usage to concrete code paths.
- CPU profiles can reveal high-cost functions (e.g., JSON processing paths)
- Memory profiles can expose bloated allocations (e.g., instrumentation code)
- Production profiling can reduce out-of-memory errors and improve latency
WHAT HAPPENS NEXT AND OF NOTE FOR DEVELOPERS
Cloudflare frames this feature as a starting point for deeper observability, with continuous profiling in development to automate collection of profiling samples. The ability to profile by specific durable objects and worker versions, and to export profiles for offline analysis, marks a shift toward diagnosing production behavior with real traffic.
If you’re using Workers and Durable Objects, you can expect more integrated observability workflows as Cloudflare expands profiling capabilities and documentation to cover broader use cases.
- Continuous profiling under development
- Broader observability workflows anticipated
RELATED COVERAGE
- Cloudflare unveils Streamline for custom video pipelines powered by Stream and Workers
- Deno Team Joins Cloudflare, Merging Workerd and Celld to Simplify Self-Hosting of Workers and Durable Objects
- Cloudflare Workers AI Agents for Edge Applications
- Stripe Projects Brings “Vibe Deploying” Into a Single Developer Workflow
- Developer Tools articles